What Spark Executor Exit Code 143 Means (and How to Fix It)
Accuracy note (2026-07-29 audit): This post was reviewed against current official documentation in July 2026 and contains inaccuracies relative to the current state of the tools described. The post is retained for its workflow reasoning; the specific factual issues are:
Two refinements: (1) YARN container-memory failures are commonly reported through YARN container exit diagnostics and may produce SIGKILL/exit 137 or YARN-specific exit statuses; exit 143 alone does not establish OOM. Use YARN diagnostics to identify the cause. (2)
peakExecutionMemoryis a Spark task metric, not an executor-level metric; cite it as a task metric. The ‘raise memory so the sum fits the YARN container’ framing reverses the relationship — Spark derives the requested container size from heap + overhead/off-heap, subject to the node limit.Reference docs to verify against:
- Apache Spark — configuration & monitoring — https://spark.apache.org/docs/latest/configuration.html
- Apache Spark — monitoring metrics — https://spark.apache.org/docs/latest/monitoring.html
Exit code 143 is one of the most misread errors in a Spark cluster. You see Executor exit code: 143 in the driver logs, the executor is gone, the stage either retries or fails, and the natural reaction is to assume the executor crashed. It did not. Exit code 143 means the executor received a SIGTERM — a termination signal — and shut down. Something deliberately asked it to stop.
The difference matters. A crash (exit code 137 = SIGKILL, or a non-zero code from an unhandled exception) is a failure you have to fix in the application. A SIGTERM is a graceful shutdown request that can come from perfectly normal cluster behavior — or from a resource pressure situation you can tune away. On Azure Synapse Spark, exit 143 shows up in three main scenarios, and the fix is different for each.
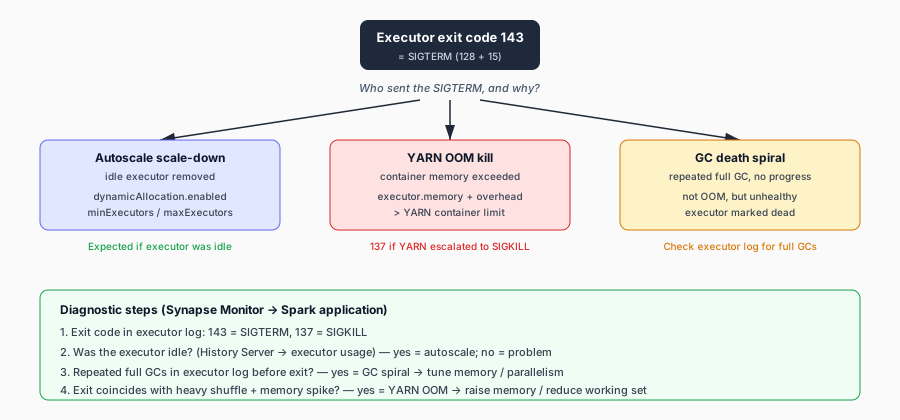
What exit 143 actually is
On Linux, when a process receives signal 15 (SIGTERM) and exits as a result, the exit code is 128 + 15 = 143. A SIGTERM is the polite version of “please stop” — unlike SIGKILL (exit 137), it lets the process clean up. The Spark executor model means an executor can receive a SIGTERM from the cluster manager (YARN), the driver, or the autoscaler. The Spark configuration docs document the decommissioning pathway: spark.decommission.enabled (default false) controls whether Spark tries to shut an executor down gracefully and migrate its blocks, and spark.executor.decommission.signal (default PWR) controls which signal triggers decommissioning.
The key diagnostic question is: who sent the SIGTERM, and why?
Cause 1: Dynamic allocation or autoscale scale-down
The most common — and usually benign — cause of exit 143 on Synapse is an executor being removed because the pool no longer needs it. The Synapse autoscale docs document two layers: pool-level autoscaling (which decommissions whole nodes based on CPU and memory metrics) and application-level dynamic allocation (which uses spark.dynamicAllocation.enabled with spark.dynamicAllocation.minExecutors and spark.dynamicAllocation.maxExecutors). When either decides the cluster is over-provisioned, idle executors receive a SIGTERM and exit with code 143.
This is expected behavior when the executor has no in-flight tasks and no un-fetched shuffle data. It only becomes a problem when the executor is removed while it still holds shuffle blocks that reduce tasks need — which then surfaces as a shuffle fetch failure (see the companion post on that).
Fix: If you are seeing exit 143 on executors that were actively running tasks, raise spark.dynamicAllocation.minExecutors so the pool does not shrink below the size a running job needs, and ensure spark.shuffle.service.enabled is on so shuffle files survive executor removal. The Synapse autoscale docs confirm both are supported on Synapse Spark pools.
Cause 2: Out-of-memory kill by YARN
YARN, which Synapse Spark pools run on, enforces a hard memory limit per container. If an executor’s total memory (heap + overhead + off-heap + Python) exceeds its YARN container allocation, YARN sends a SIGTERM (and, if the process does not exit quickly, a SIGKILL) to protect the node. The executor exits with 143.
The Spark configuration docs document the pieces that sum to the container size: spark.executor.memory (the JVM heap, default 1g), spark.executor.memoryOverhead (non-heap memory — VM overhead, interned strings, native allocations — defaulting to executorMemory * spark.executor.memoryOverheadFactor with spark.executor.memoryOverheadFactor default 0.10), spark.memory.offHeap.size (if off-heap is enabled), and spark.executor.pyspark.memory (for PySpark). The container ceiling is the sum of all of these.
The Synapse performance docs add the platform guidance: start at ~30 GB per executor, keep the heap below 32 GB to keep GC overhead under 10%, and watch GC — a heap that is too large pauses long enough to look like a dead executor.
How to tell it is OOM: Check the executor logs for Container killed by YARN for exceeding memory limits or a similar YARN message. The exit code will be 143 if YARN sent SIGTERM first, or 137 if it escalated to SIGKILL. Then look at the Spark UI executor metrics — the Spark monitoring docs expose peakExecutionMemory, OnHeapExecutionMemory, OffHeapExecutionMemory, and JVMHeapMemory per executor. If peak execution memory is bumping the container limit, the executor is OOM.
Fix: Raise spark.executor.memory and spark.executor.memoryOverhead so the sum fits the YARN container, reduce the per-task working set by increasing parallelism (spark.default.parallelism / spark.sql.shuffle.partitions — the tuning docs recommend 2–3 tasks per core), and prefer reduceByKey over groupByKey (the Synapse performance docs call this out explicitly) so the map-side aggregation shrinks the data before it hits the reduce task’s hash table.
Cause 3: GC death spiral
A subtler cause: the executor is not technically OOM, but its JVM is spending almost all its time in garbage collection and making no forward progress. The Spark tuning docs describe this directly — “if a full GC is invoked multiple times before a task completes, it means that there isn’t enough memory available for executing tasks.” The driver or YARN may eventually conclude the executor is unhealthy and send a SIGTERM.
The tuning docs also note that since Spark 4.0, G1GC is the default garbage collector, and that with large executor heap sizes it may be important to increase the G1 region size with -XX:G1HeapRegionSize. GC options for executors are set via spark.executor.extraJavaOptions or spark.executor.defaultJavaOptions.
Fix: First, measure GC. The tuning docs recommend adding -verbose:gc -XX:+PrintGCDetails -XX:+PrintGCTimeStamps to executor Java options and reading the worker logs. If full GCs are firing repeatedly mid-task, the executor needs more memory, fewer concurrent tasks, or serialized caching (MEMORY_ONLY_SER with Kryo, which the tuning docs recommend). The Synapse performance docs note Kryo serialization is enabled by default on Synapse Spark Runtime 3.1+, and that you can tune the buffer with spark.kryoserializer.buffer.max.
How to diagnose which one it is
The Synapse monitoring docs are your starting point. Open Monitor > Apache Spark applications, find the failed/affected application, and look at the executor list and the failed tasks. Then:
- Check the exit code in the executor log. 143 = SIGTERM, 137 = SIGKILL. A 137 that comes with a YARN “exceeded memory limits” message is a hard OOM; a 143 that comes with no YARN message is usually a deliberate shutdown.
- Check whether the executor was idle. The Synapse Spark History Server docs expose executor usage and decommissioning. An idle executor exiting 143 during autoscale scale-down is expected; a busy one exiting 143 is a problem.
- Check GC. If the executor log shows repeated full GCs immediately before the exit, it is a GC death spiral — tune memory or parallelism.
- Check the timing against autoscale events. If the exit coincides with a pool scale-down, it is cause 1; if it coincides with a heavy shuffle stage and a memory spike, it is cause 2.
Exit 143 is not a bug. It is a signal that something decided the executor should stop. Your job is to figure out who decided, why, and whether the decision was correct — and then to either tune the workload so the decision stops happening (causes 2 and 3) or make the shuffle resilient to it (cause 1).
Sources
- Apache Spark Configuration — Application Properties & Decommissioning —
spark.executor.memory,spark.executor.memoryOverhead,spark.executor.memoryOverheadFactor,spark.memory.offHeap.size,spark.decommission.enabled,spark.executor.decommission.signal. - Apache Spark Tuning Guide — Garbage Collection Tuning — full GC as an out-of-memory signal, G1GC default,
-XX:G1HeapRegionSize, serialized caching with Kryo. - Apache Spark Monitoring — Executor Metrics —
peakExecutionMemory,OnHeapExecutionMemory,JVMHeapMemory, minor/major GC counts and times. - Optimize Spark jobs for performance — Azure Synapse Analytics — 30 GB per executor, <32 GB heap for GC <10%,
reduceByKeyovergroupByKey, Kryo default +spark.kryoserializer.buffer.max. - Autoscale for Azure Synapse Analytics Apache Spark pools —
spark.dynamicAllocation.enabled,minExecutors,maxExecutors, node decommissioning. - Monitor Apache Spark applications in Azure Synapse Analytics — executor list, failed-task inspection, driver/executor logs.
- Spark History Server in Azure Synapse Analytics — executor usage, data skew, failed-task inspection.